Freight systems involve a complex network of infrastructure, policies, and logistics that are often difficult to communicate to non-technical audiences. As lead designer, I collaborated with engineers and planners to translate freight planning concepts into a clear and engaging visual narrative.
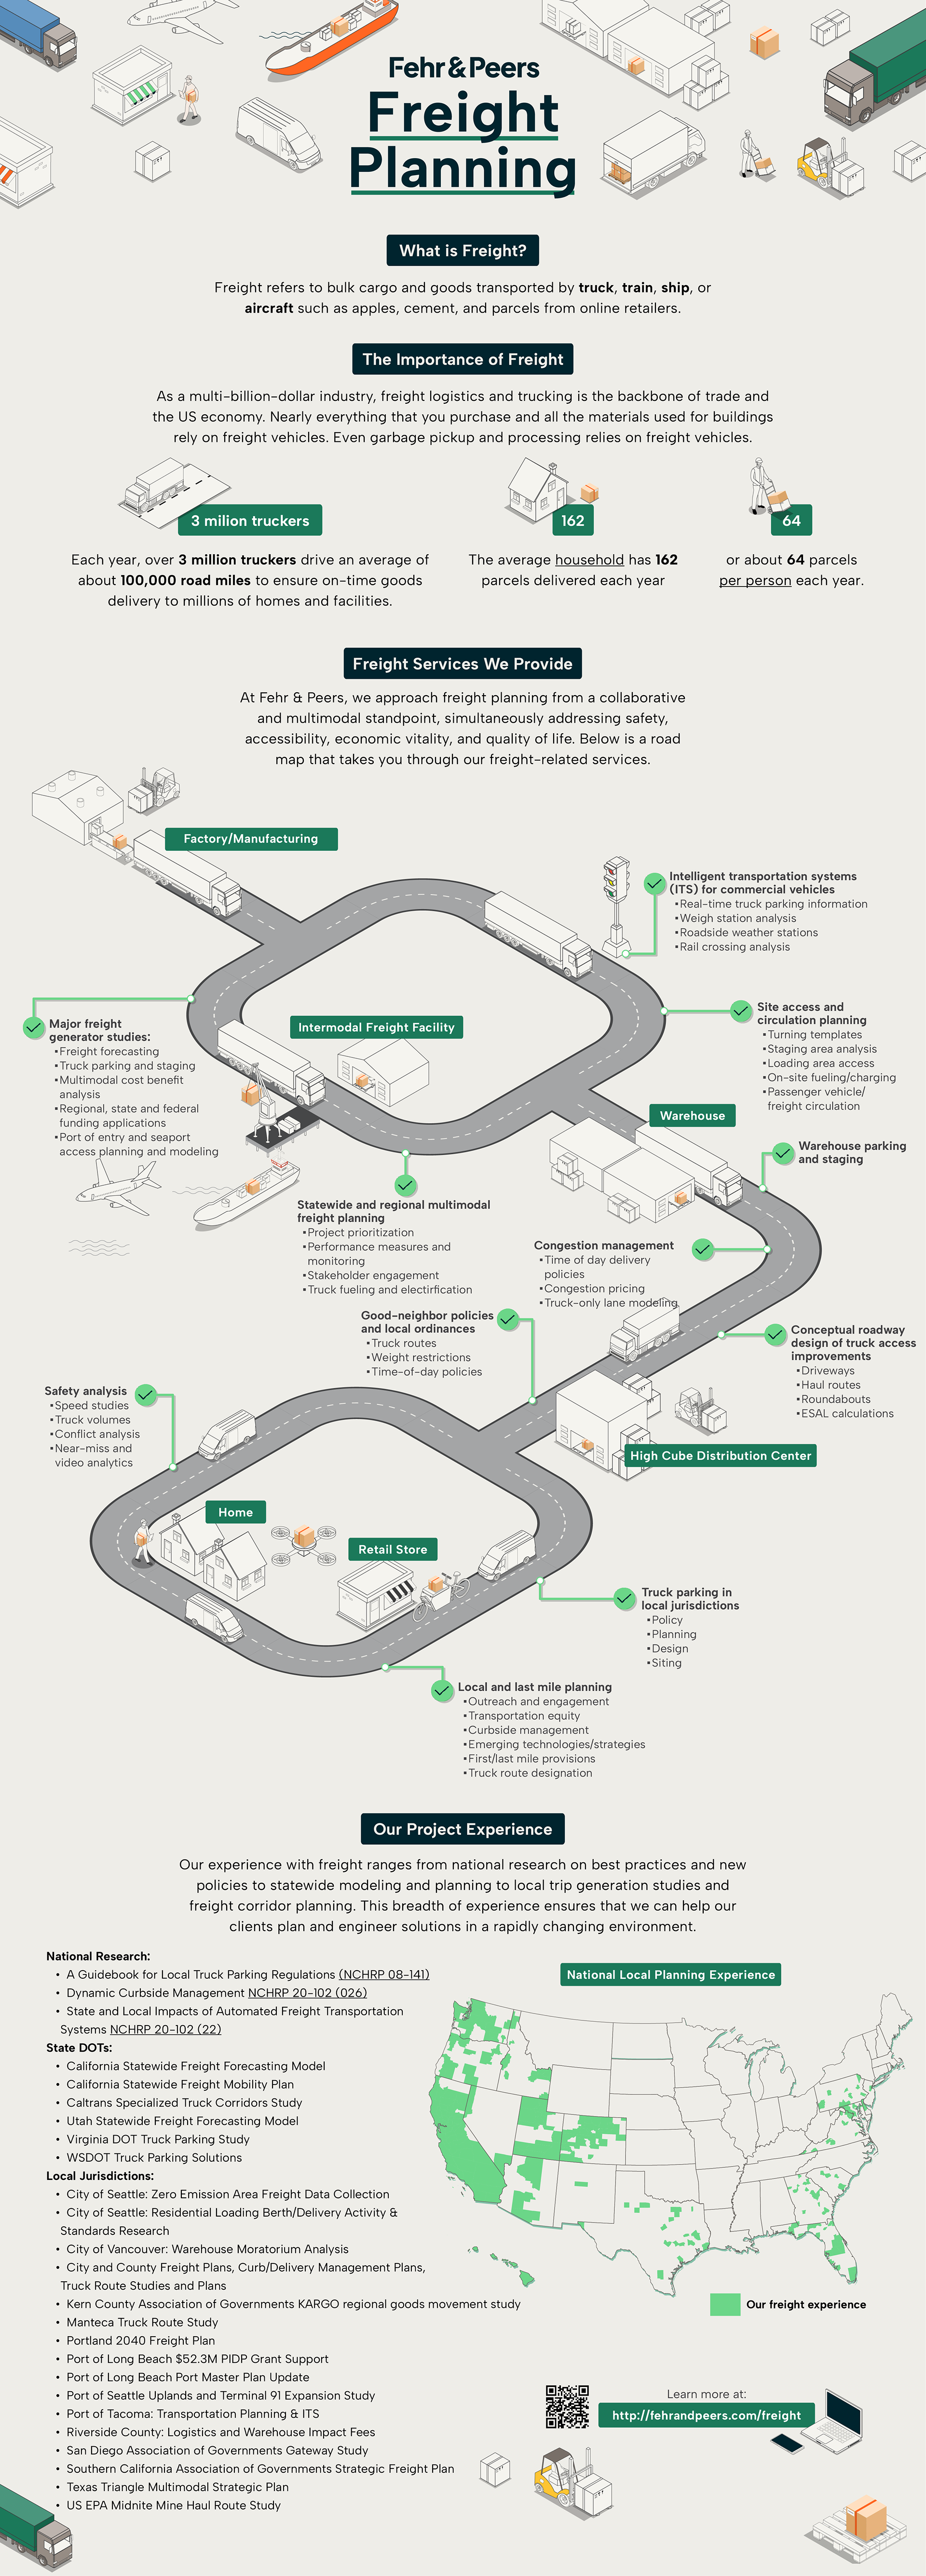
I designed a long-form infographic that follows the journey of a parcel from manufacturing to final delivery, using a continuous visual path to connect each stage of the system. The layout organizes multiple layers of information including freight services, infrastructure, and policy considerations into a cohesive flow that is easy to follow. Visual hierarchy, iconography, and spatial sequencing guide the viewer through the story while maintaining clarity across a dense set of information.
The final graphic supports communication and outreach by making freight planning more understandable and accessible to a broad audience while also promoting the freight services provided by our firm.
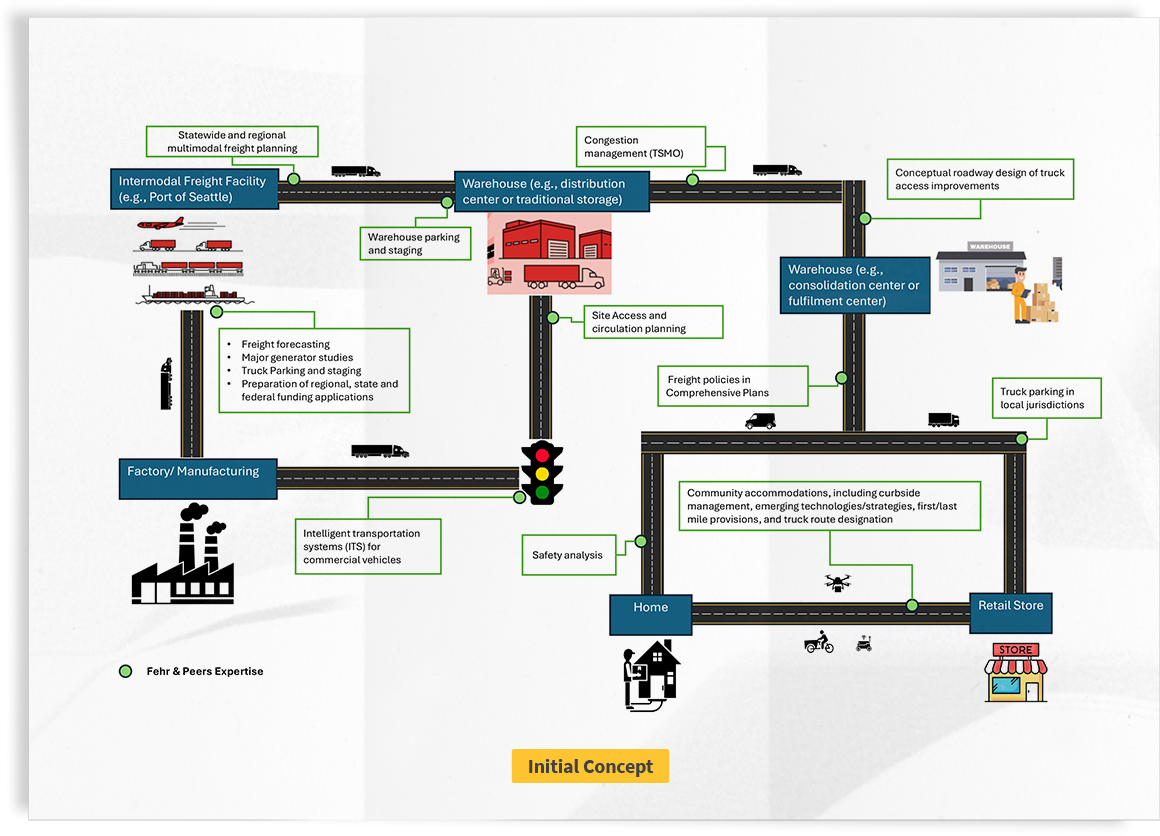
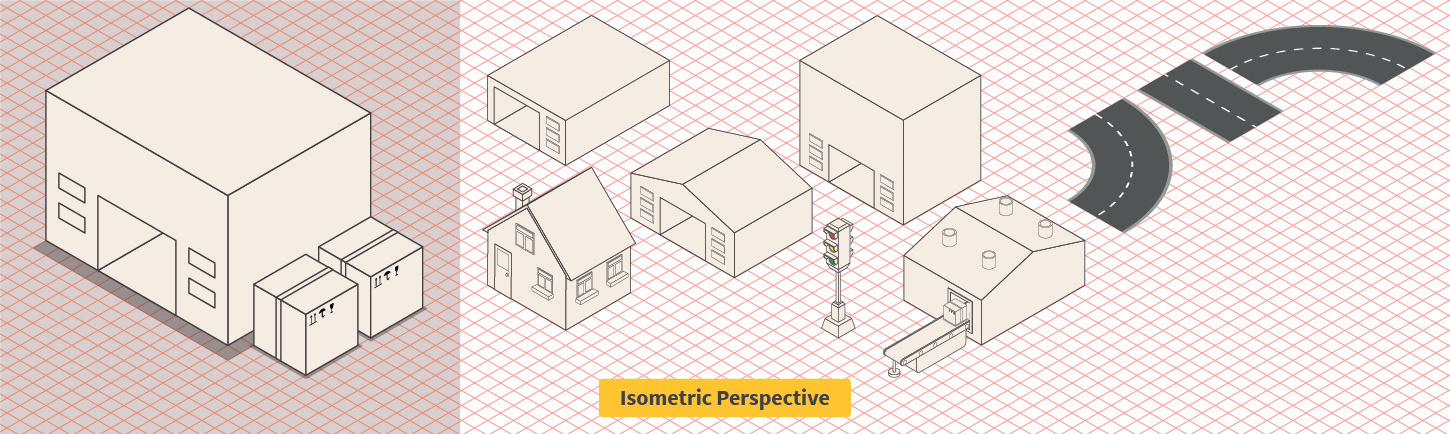
Early Concept Sketch
Mapping the freight journey and identifying key system components before visual development: