This project explores how new high-rise housing in downtown Bellevue is occupied over time. Using projected data from 2020 to 2025, I developed an animated visualization that reveals patterns of residential growth and density within the evolving urban core.
I translated building occupancy data into an isometric perspective with animation to show how housing activity changes over time in downtown Bellevue, WA. The resulting animation guides the viewer from 2020 through 2025, highlighting how individual buildings contribute to broader growth trends. The visualization provides a perspective on how population growth is shaping downtown Bellevue and supports discussions around planning, capacity, and livability.
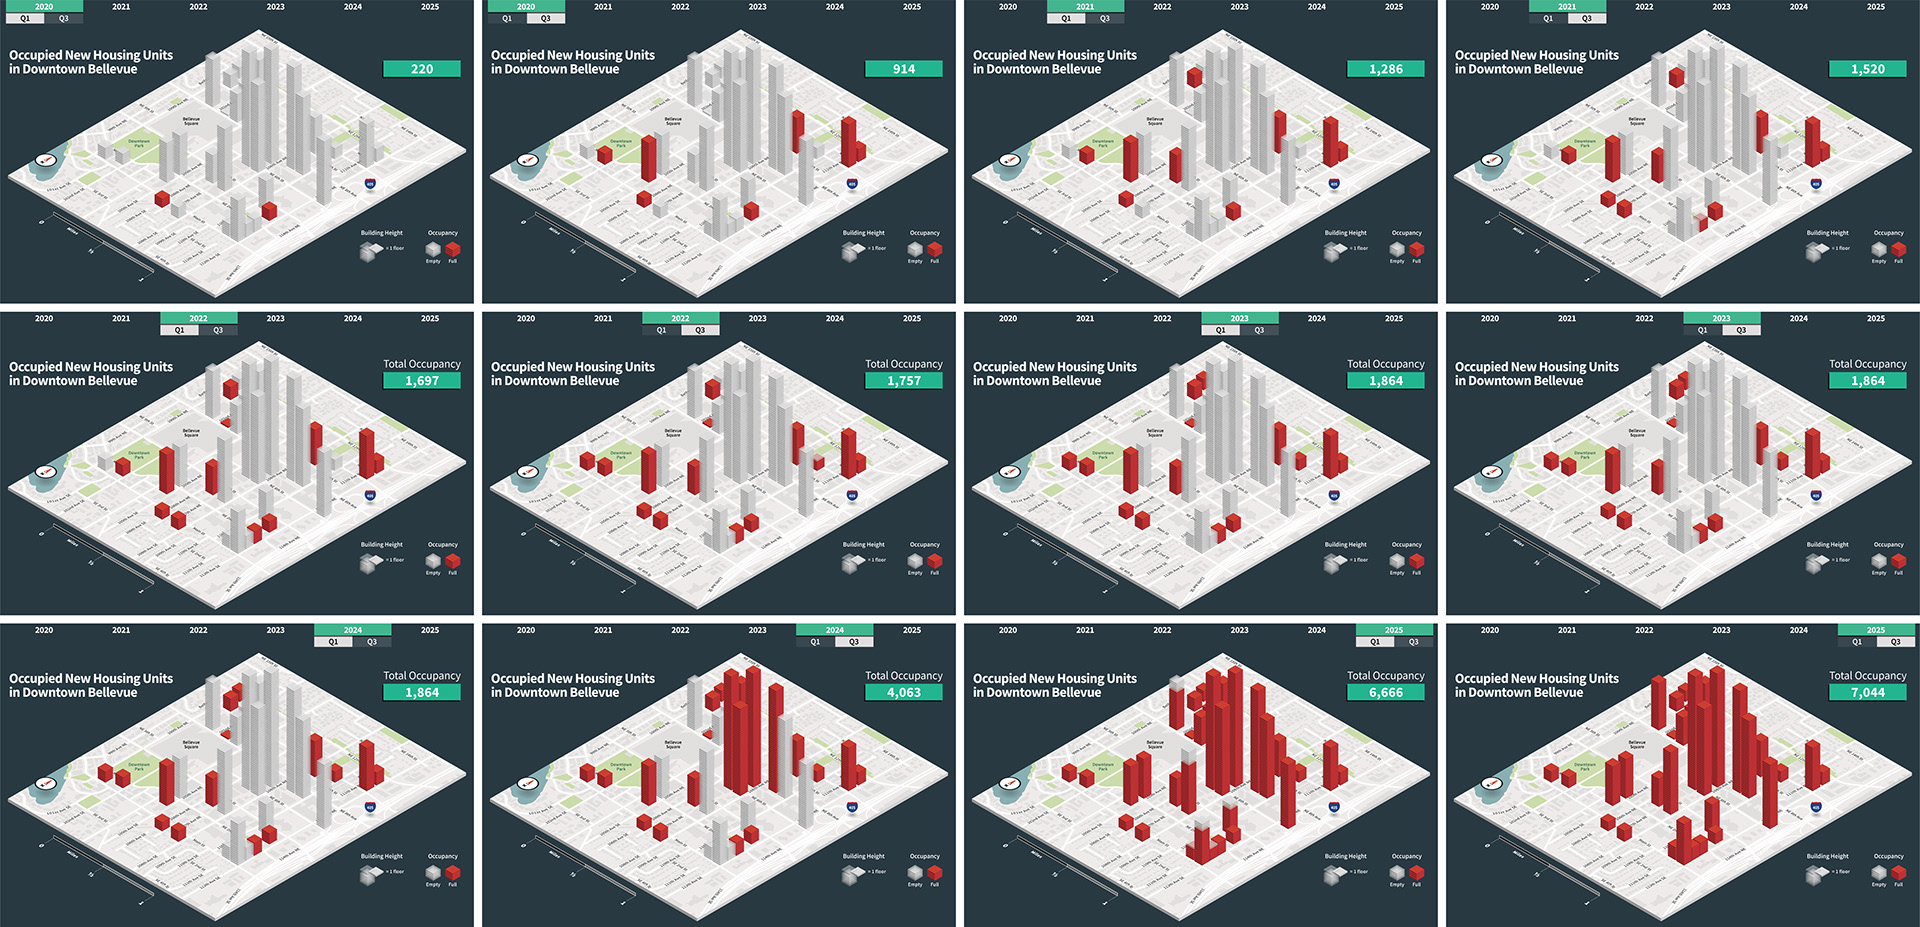
Note: Details such as street names and dates have been modified for confidentiality.